Understanding BRI — and why it isn't exactly AHI.
SomniSense reports a metric called BRI — Breathing Irregularity Index. It's the headline number in your morning report. People sometimes ask me whether BRI is "the same as AHI" and the honest answer is "it's the same scale, but they're not interchangeable for medical purposes." This article is the long version of that answer.
What BRI is
BRI is the per-hour count of breathing-irregularity events SomniSense detects from acoustic analysis. An event is one of two things:
- Apnea-like event — breathing fully stops for at least 10 seconds, ending with a gasp or arousal pattern.
- Hypopnea-like event — breathing significantly reduces (typically >30% airflow reduction) for at least 10 seconds.
Add them up over the course of the night, divide by hours of sleep, and that's your BRI. Same arithmetic as the AHI calculation a sleep specialist would do from a polysomnography study.
What AHI is
AHI = Apnea-Hypopnea Index. The clinical metric used to diagnose obstructive sleep apnea. The same per-hour event count, but measured under different conditions:
- You're in a sleep lab (or wearing an HSAT device at home)
- You have a chest belt measuring respiratory effort
- You have a finger pulse oximeter measuring blood oxygen
- You may have nasal/oral airflow sensors directly measuring breath volume
- An AASM-trained sleep technician scores each event with full clinical criteria
AHI thresholds:
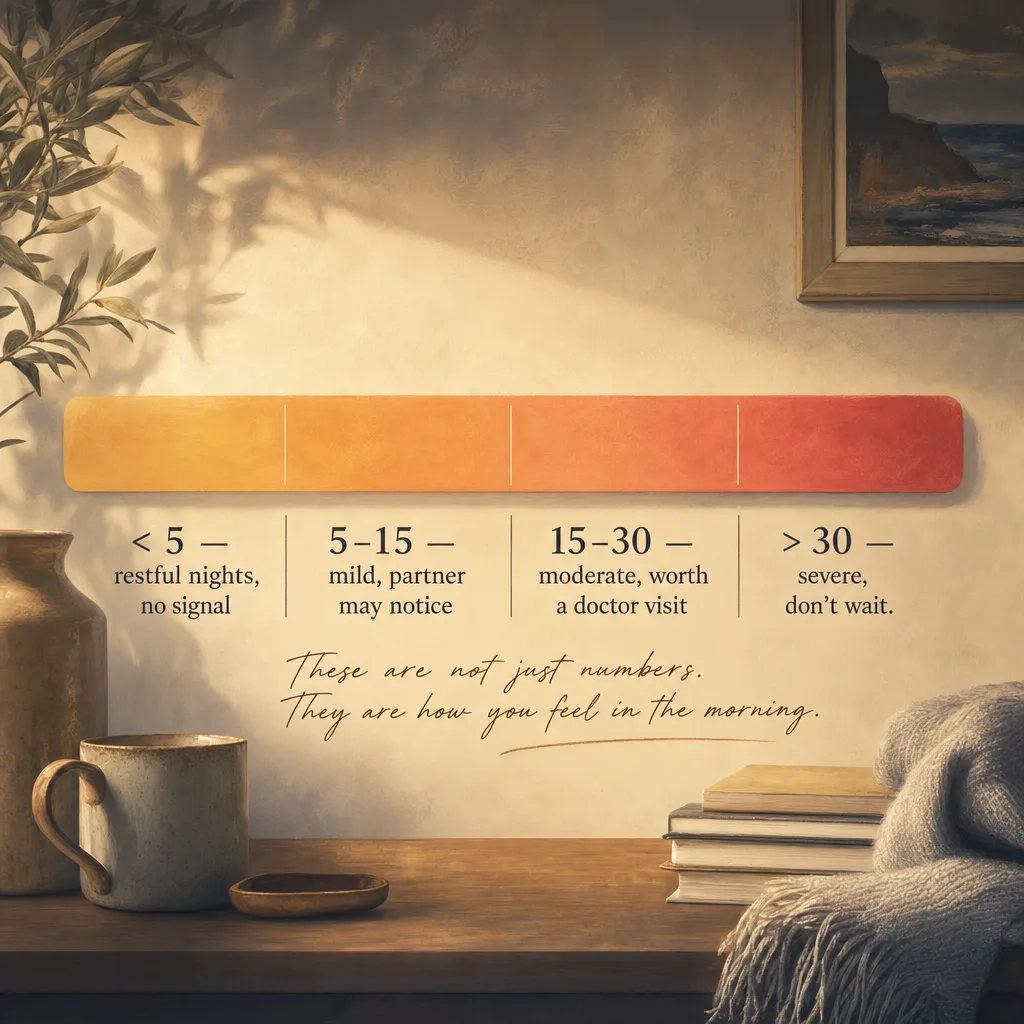
BRI uses the same scale and the same thresholds. A BRI of 18 corresponds to what clinicians describe as moderate range. A BRI of 4 is in normal range. Same numerical scale, same severity ranges.
Why BRI isn't called AHI
Three reasons, all of them important to me:
1. The measurement source is different
AHI is measured with multi-channel sensors including direct airflow and oxygen. BRI is measured acoustically — from a microphone — without direct airflow or oxygen monitoring. We catch the events that produce sound or detectable acoustic patterns. We can miss events that don't (a small set of central apneas can be acoustically subtle).
Calling our acoustic-only metric "AHI" would imply we're measuring it the same way a clinic measures it. We're not. Naming it BRI is a way of being honest about that.
2. The validation is internal, not clinical
Our BRI agrees with PSG-measured AHI within ±5 events/hour for 87% of nights at AHI ≤ 30 — that's the Bland-Altman number from our n=80 paired PSG nights paired-night validation. That's a strong agreement, but it's not the same as saying "BRI = AHI." Calling it AHI would imply diagnostic equivalence we don't claim.
3. We're a wellness tool, not a medical device
This is the regulatory reason. AHI is the clinical metric used to diagnose a medical condition. We don't diagnose anything. Calling our metric AHI would create the appearance of clinical claim that doesn't fit a wellness app's role. Naming it BRI keeps the relationship clear: same scale (so your doctor can read it directly), different measurement source (so we're not pretending to be a medical device).
How to read your BRI
Use the same severity intuition you'd use for AHI:
- BRI < 5 — normal range. Most healthy adults. If you're feeling tired despite this, the cause is probably elsewhere (sleep duration, stress, thyroid, mental health, anemia, etc.).
- BRI 5-15 — mild range. Often responsive to lifestyle changes (side-sleep, less alcohol, weight loss). Worth a clinic conversation if symptomatic.
- BRI 15-30 — moderate range. Worth a sleep specialist consult. Bring the data.
- BRI > 30 — severe range. Strong recommendation for clinical assessment. Don't wait six months trying lifestyle interventions on this number.
What to bring to your doctor
If you're going to a sleep specialist with SomniSense data, the most useful framing is:
- "I've been tracking with a smartphone app called SomniSense."
- "It reports a metric called BRI on the same per-hour scale you use for AHI."
- "My BRI averages around X over [time period] of nights."
- "Here's the monthly Doctor-Ready Cadence™ PDF showing the trend." [hand them the PDF]
Most sleep specialists will be happy to look at the data. Some won't be familiar with the app — that's fine, the per-hour event-rate framing is universal. The PDF is formatted for clinician readability.
What the specialist will likely do: order an HSAT or PSG to confirm the AHI, then build a treatment plan from the formal study. SomniSense data accelerates the conversation but doesn't replace the formal study.
One more nuance — clustering matters
This is the thing AHI alone misses, and where BRI plus the timeline view becomes more useful than just the average:
Two people can have a BRI of 5 (technically normal). For the first person, the events are spread evenly across 8 hours — basically negligible. For the second person, all 5 events happen between 3 a.m. and 5 a.m. during REM-dominant sleep, where each event has more impact on cognition the next day.
Average BRI doesn't tell you that. The Every-Event Timeline does. More on the timeline view here.
Read next
If you'd rather see your own night than read about someone else's —
It's free on both stores. Put the phone on the nightstand tonight; the report is there when you wake up.
First 7 days of Pro are free · then $7.99/mo or $49.99/yr · cancel before day 8 and you pay nothing.