See where it happened
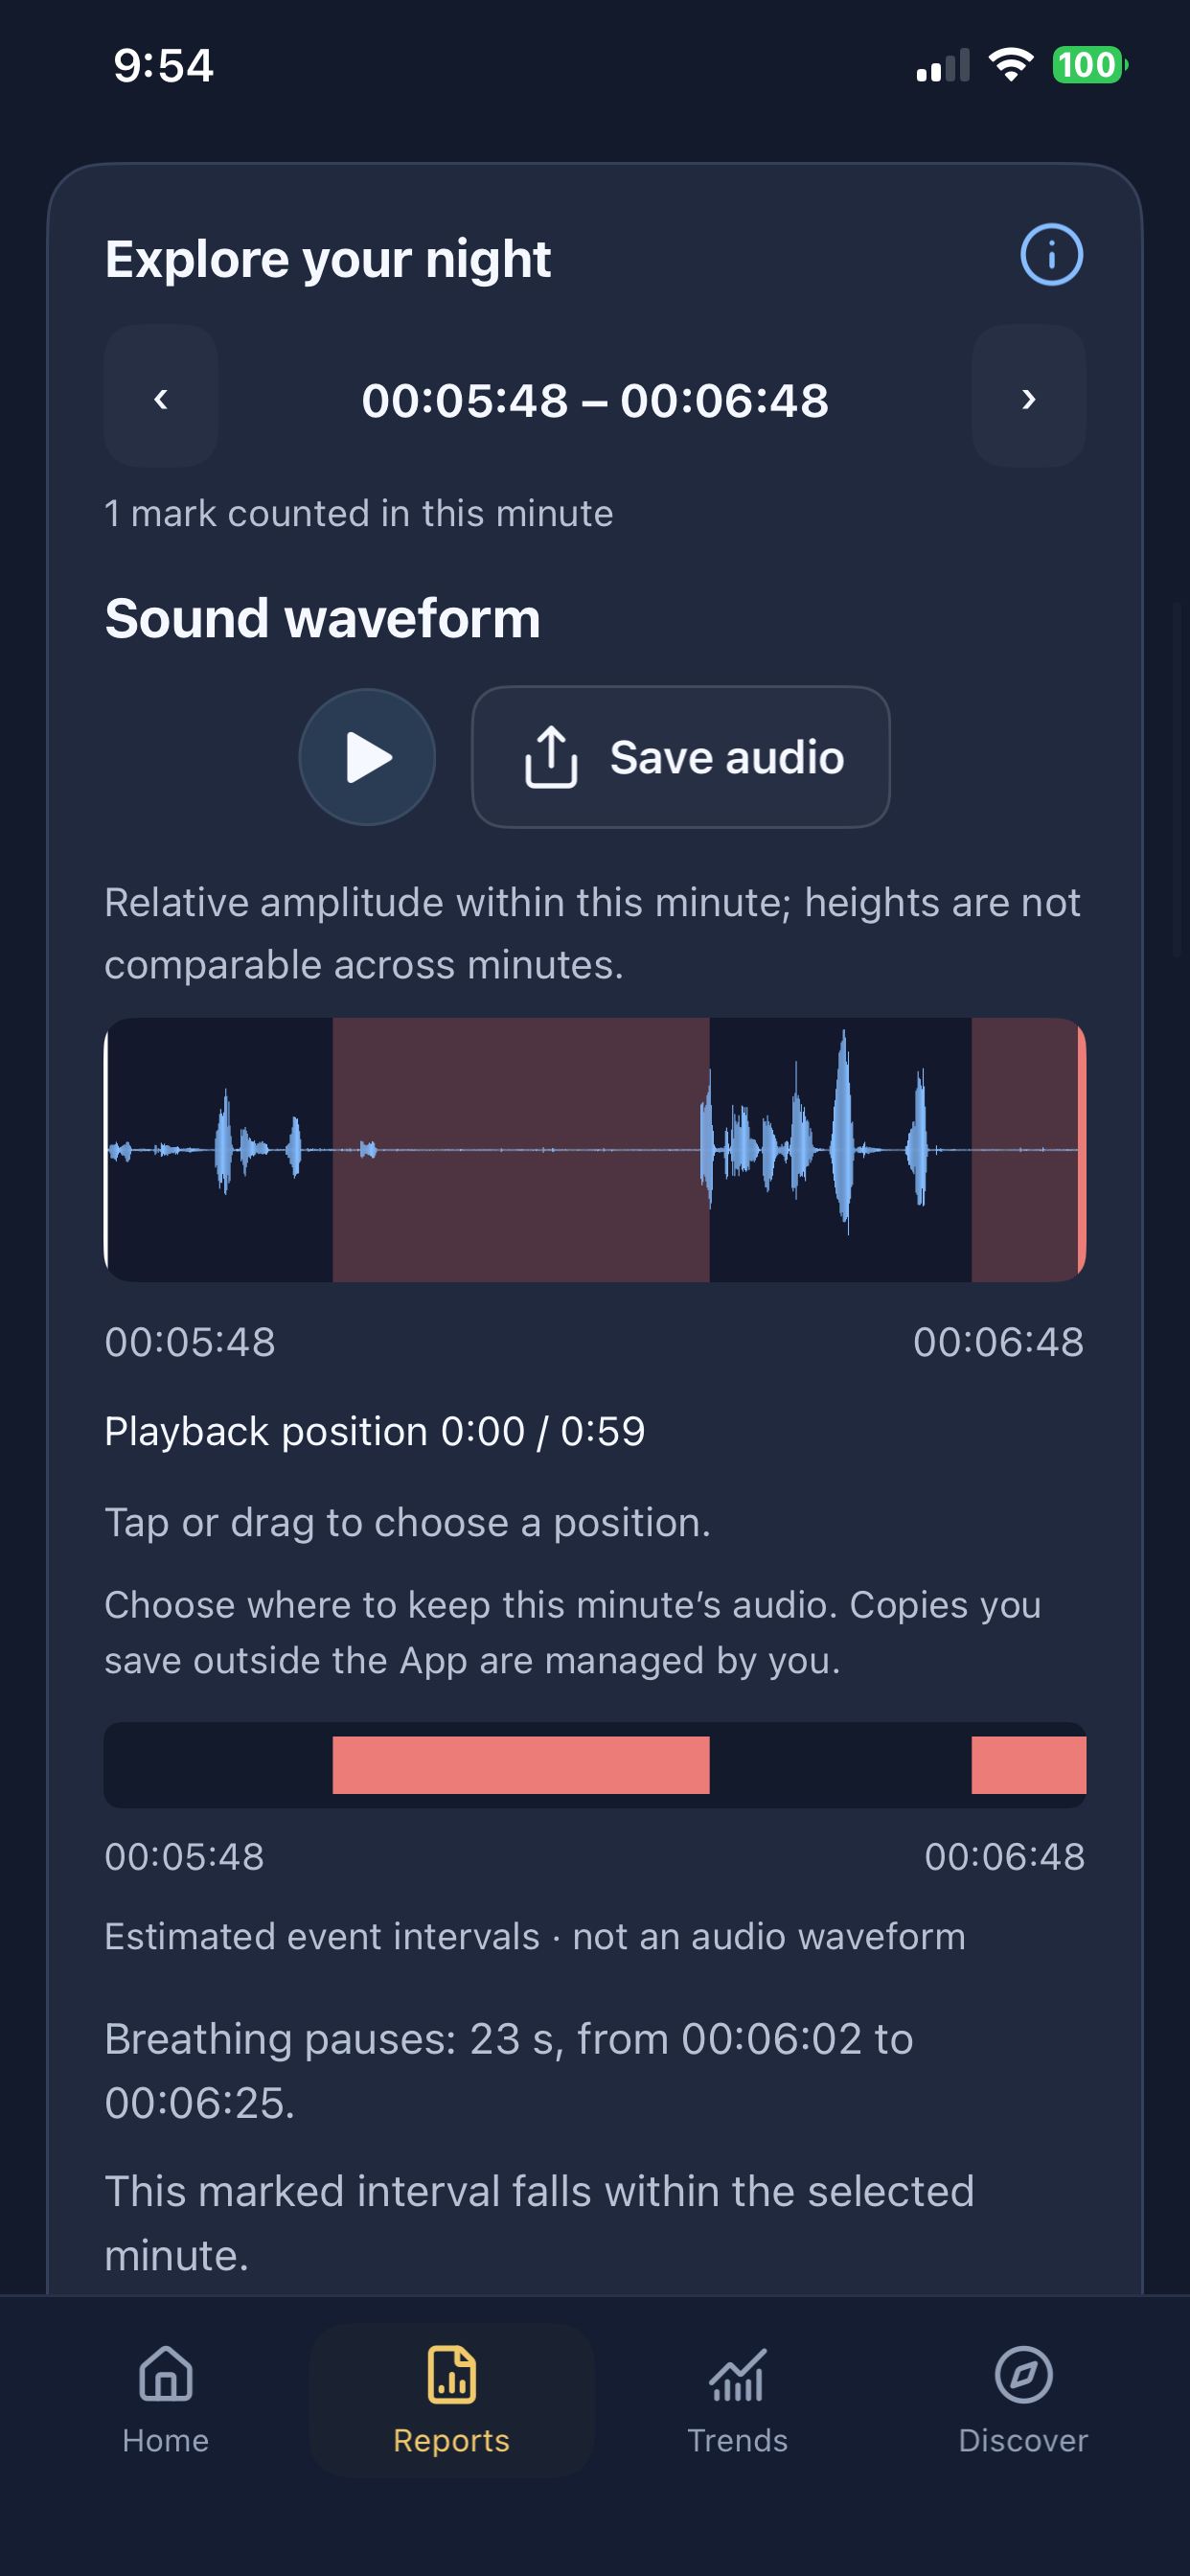
Locate candidate pause-like and shallow-breathing-like patterns within the night. Review their estimated time and duration.
Sleep breathing monitoring
Your bedside phone turns overnight sounds into breathing observations you can review. See marked events, listen to the surrounding sounds, and follow what changes across nights.
One valid night of breathing monitoring is free. Continued breathing monitoring requires Pro.
For iPhone and Android. No watch, ring or extra monitoring hardware needed.
Sound-based wellness monitoring. Not a diagnosis or a substitute for a sleep test.
From a night of sound to something you can check
A summary is a starting point. The useful next step is finding the moment behind it.
Locate candidate pause-like and shallow-breathing-like patterns within the night. Review their estimated time and duration.
Follow the marked waveform and replay available sounds before and after a candidate interval, rather than relying on a label alone.
Already replay snoring recordings? Review marked breathing-sound patterns with the sounds before and after.
See how review works →Return to the whole night, then compare nights. Breathing observations come first; snoring adds a separate layer of context.
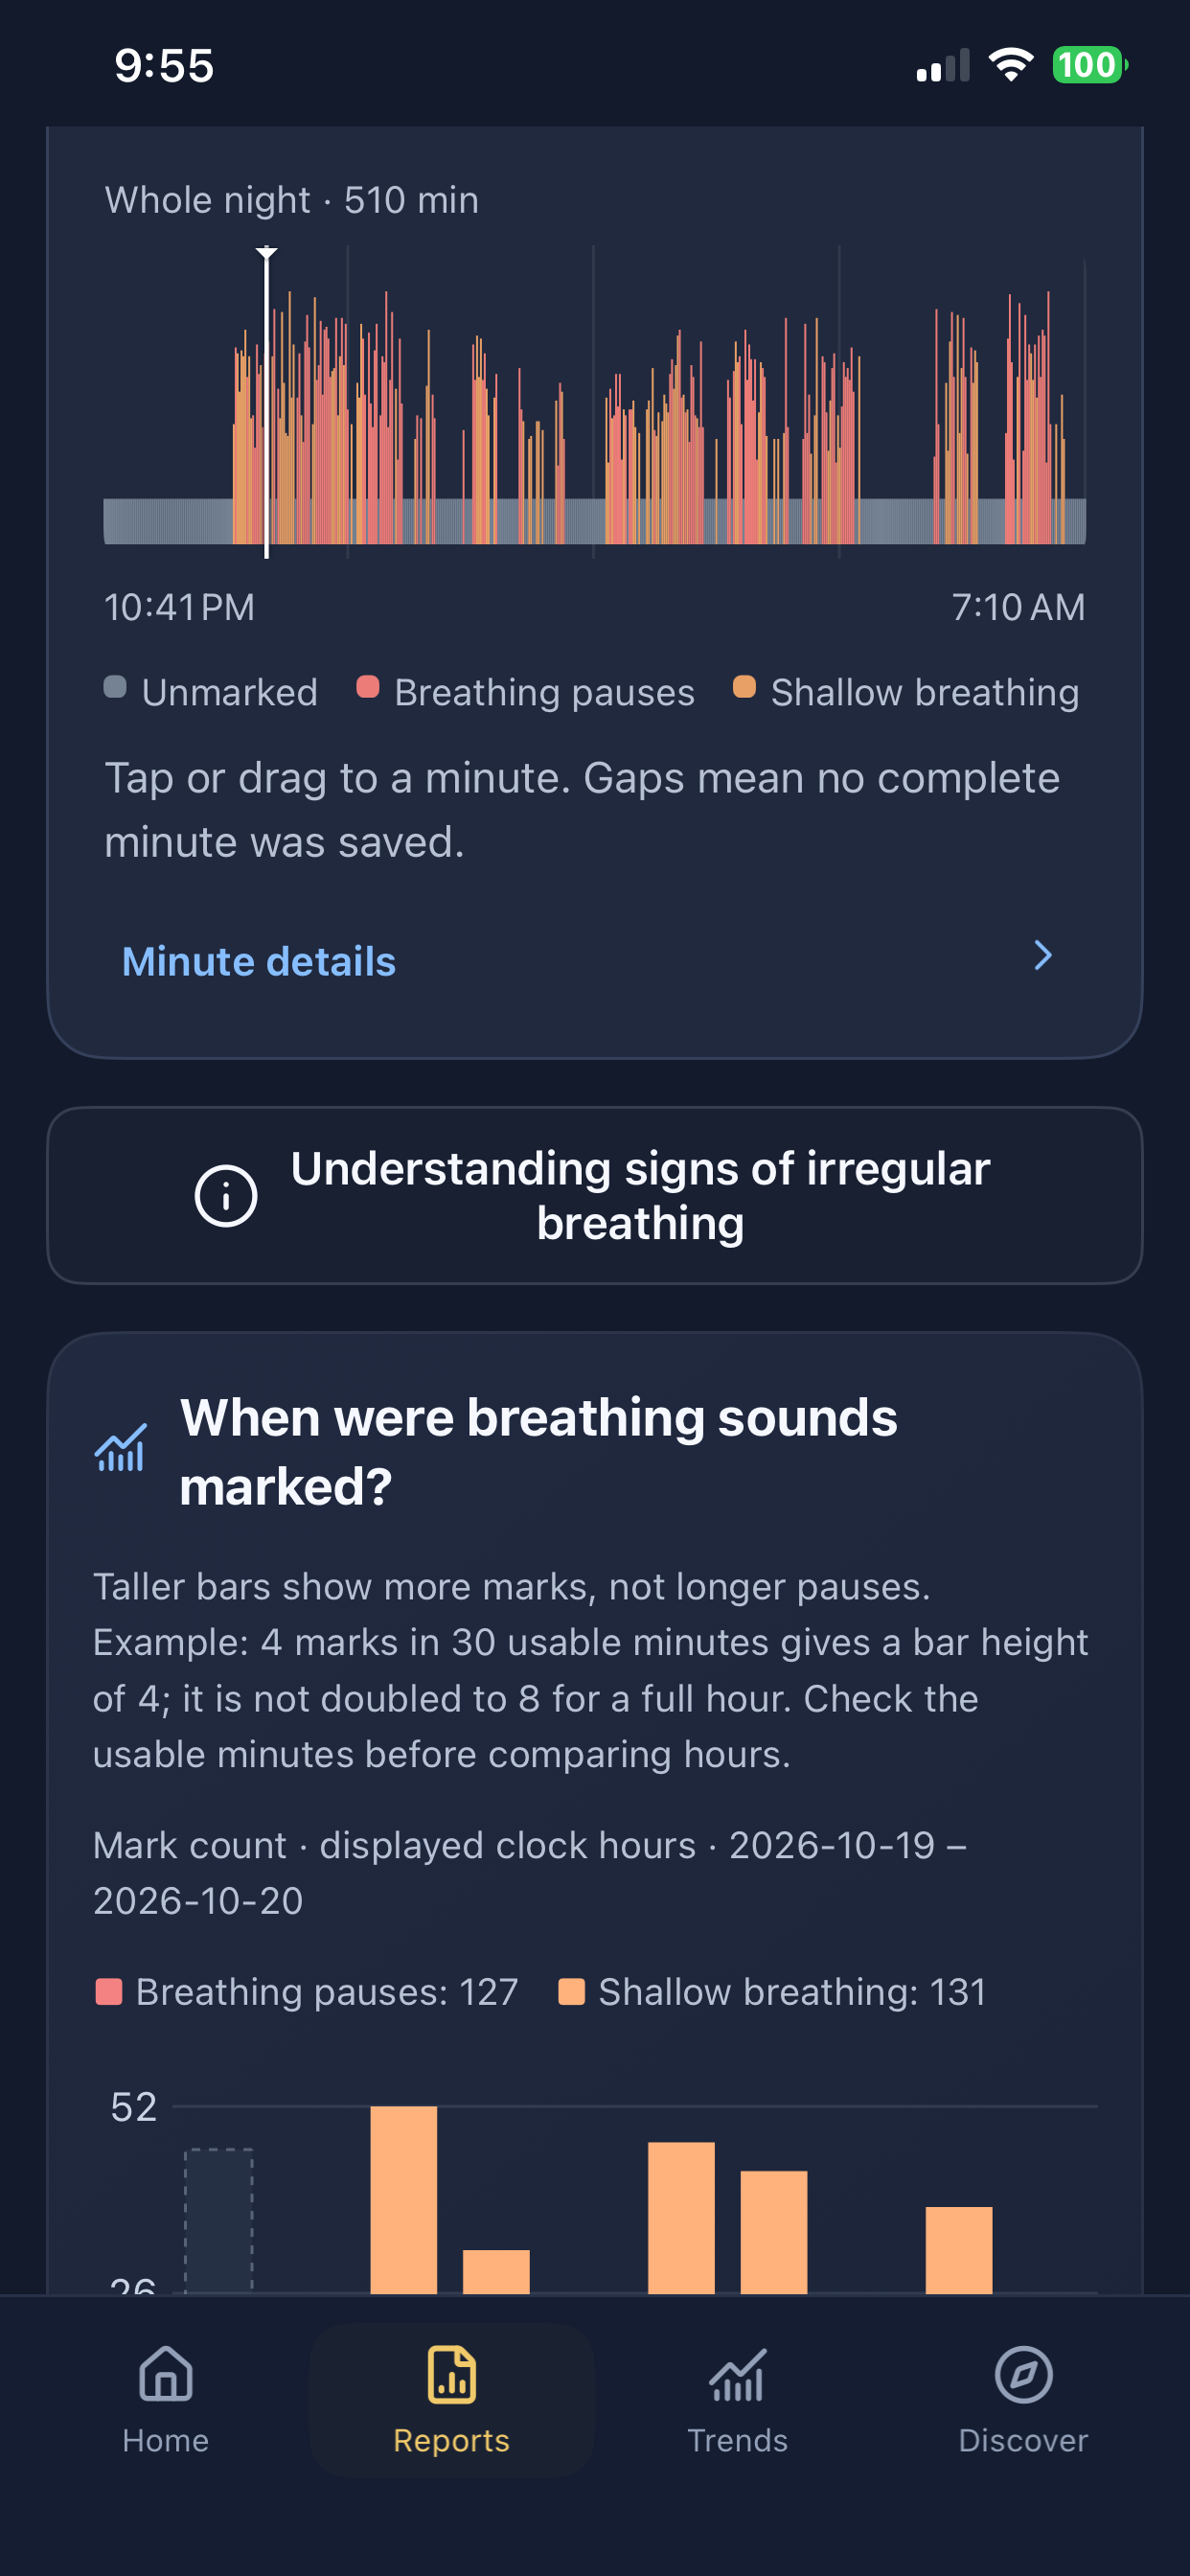
Version 1.2.0 interface examples, not an interactive demo. The screenshots illustrate different views; they are not a matched clinical comparison.
These are model-estimated acoustic patterns, not confirmed clinical breathing events. A recording can miss events or contain no candidates; no candidates does not rule out sleep apnea.
The value of coming back
Find your usual range, revisit an unusual night, and compare nights with and without a change you chose to tag. Keep breathing and snoring observations separate.
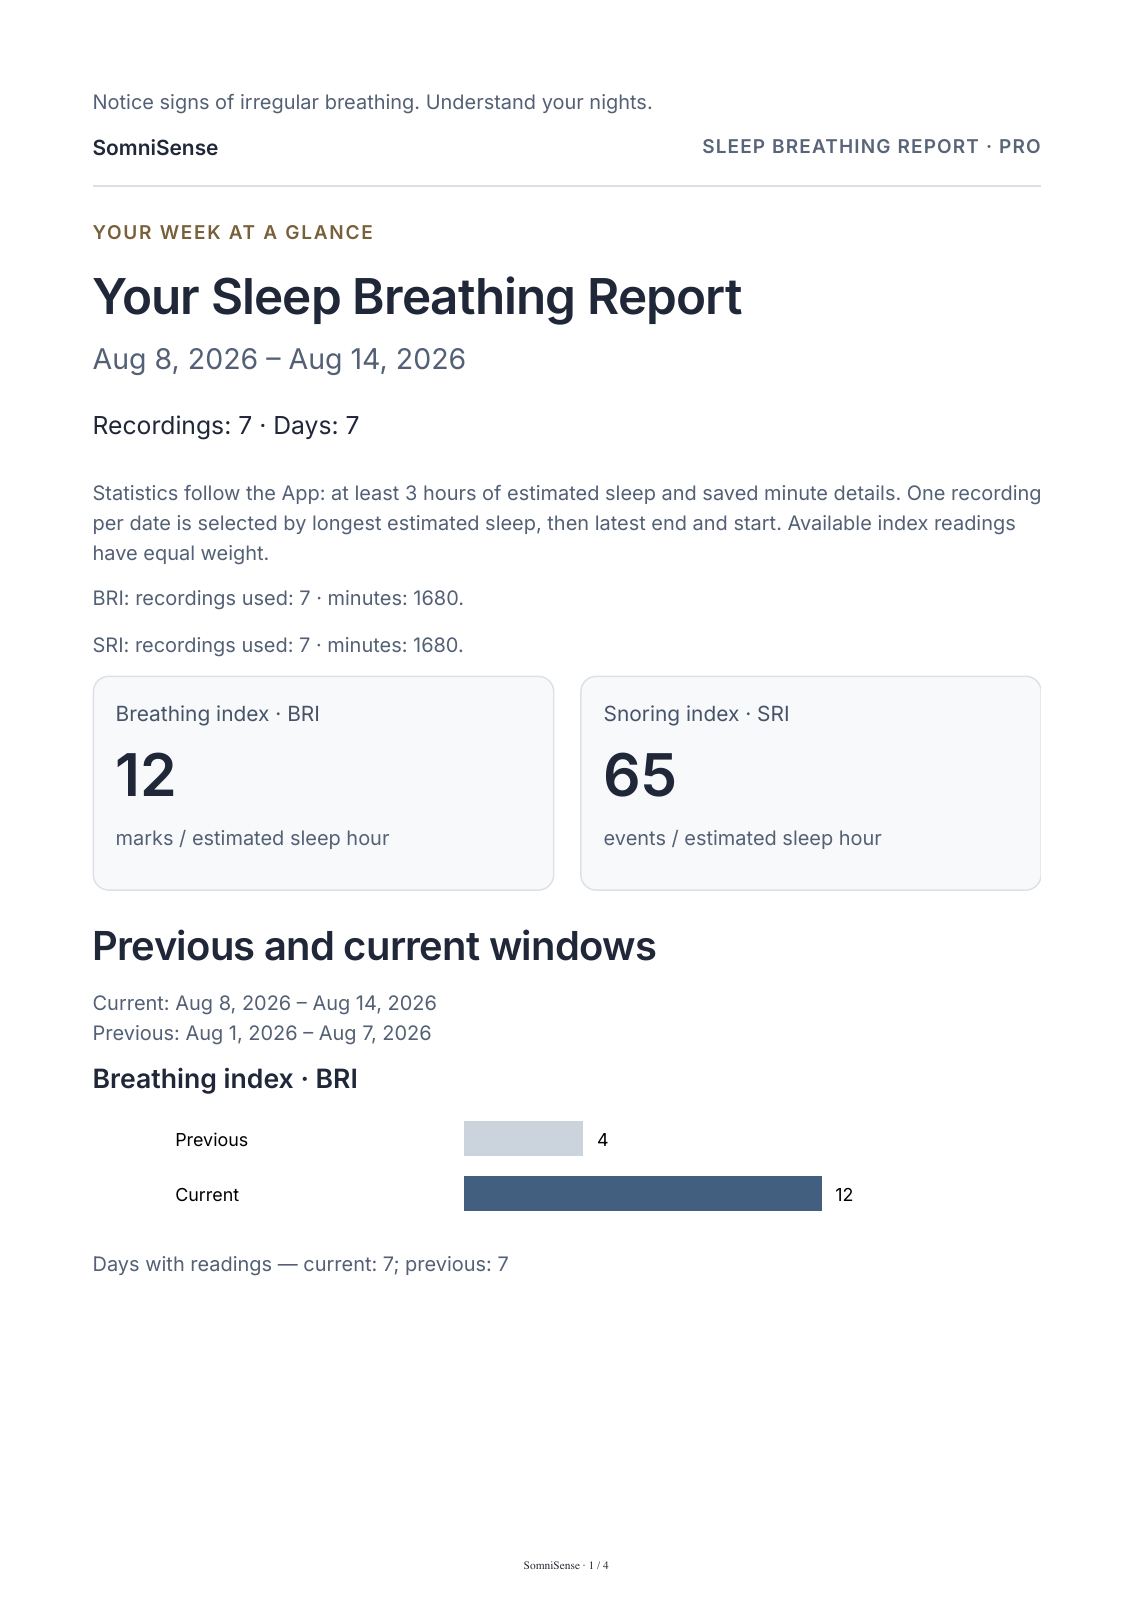
A structured PDF brings the observation period, nightly patterns, comparisons and interpretation limits together for you to save or share.
Observed differences do not establish a cause or show that a treatment worked.
Start with your question
Clear evidence. Clear limits.
Read the sound-analysis research, the tasks tested and their limitations. A research benchmark is not your personal diagnostic accuracy.
Read the evidence →Audio and waveforms stay local, with no cloud recovery. Account and recording results sync for services such as email reports. Exported sound copies are yours to manage.
Read the privacy policy →SomniSense does not measure airflow or blood oxygen. If you are concerned about symptoms, speak with a qualified health professional.
Explore the research →Begin with your own night
Download the app, follow the bedside setup, and review your recording after sleep. Experience one valid night of breathing monitoring free. Continue with Breathing Pro when following your observations across nights is useful to you.
After your first valid breathing night, continued breathing monitoring requires Pro. Snoring remains available free.
It is used by your first completed Breathing report showing more than 30 minutes of sleep and detected snoring. Reports before that qualifying recording and the qualifying report itself remain free. A failed recording, a report showing 30 minutes of sleep or less, or a recording with no detected snoring does not use the experience. A recording with no detected snoring does not rule out a breathing problem. A valid report with no breathing candidates still counts; no candidates does not rule out sleep apnea.
A bedside phone can capture another sleeper or room and equipment sounds. Place it closer to the person being recorded and review the surrounding sound. SomniSense cannot reliably separate two sleepers or confirm whose sound was captured. Performance with CPAP sound has not been established; do not use this record to judge treatment or change therapy. Two recording apps may compete for microphone access, so simultaneous recording is not guaranteed.
Your audio and waveforms stay on your phone. SomniSense does not provide cloud recovery for them. Account information, access status and recording results are synced as described in the Privacy Policy, including results used for email reports. Audio leaves the phone only when you choose to export or share it. Copies saved outside the app are managed by you.