CANDIDATE EVENT TIMELINE
Where in the night did that possible pause happen?
Start with the whole night, choose a marked minute, then inspect the candidate waveform and surrounding sounds. Times and durations are model estimates, not clinical event measurements.
Start with Free to review your first night. No new hardware needed.
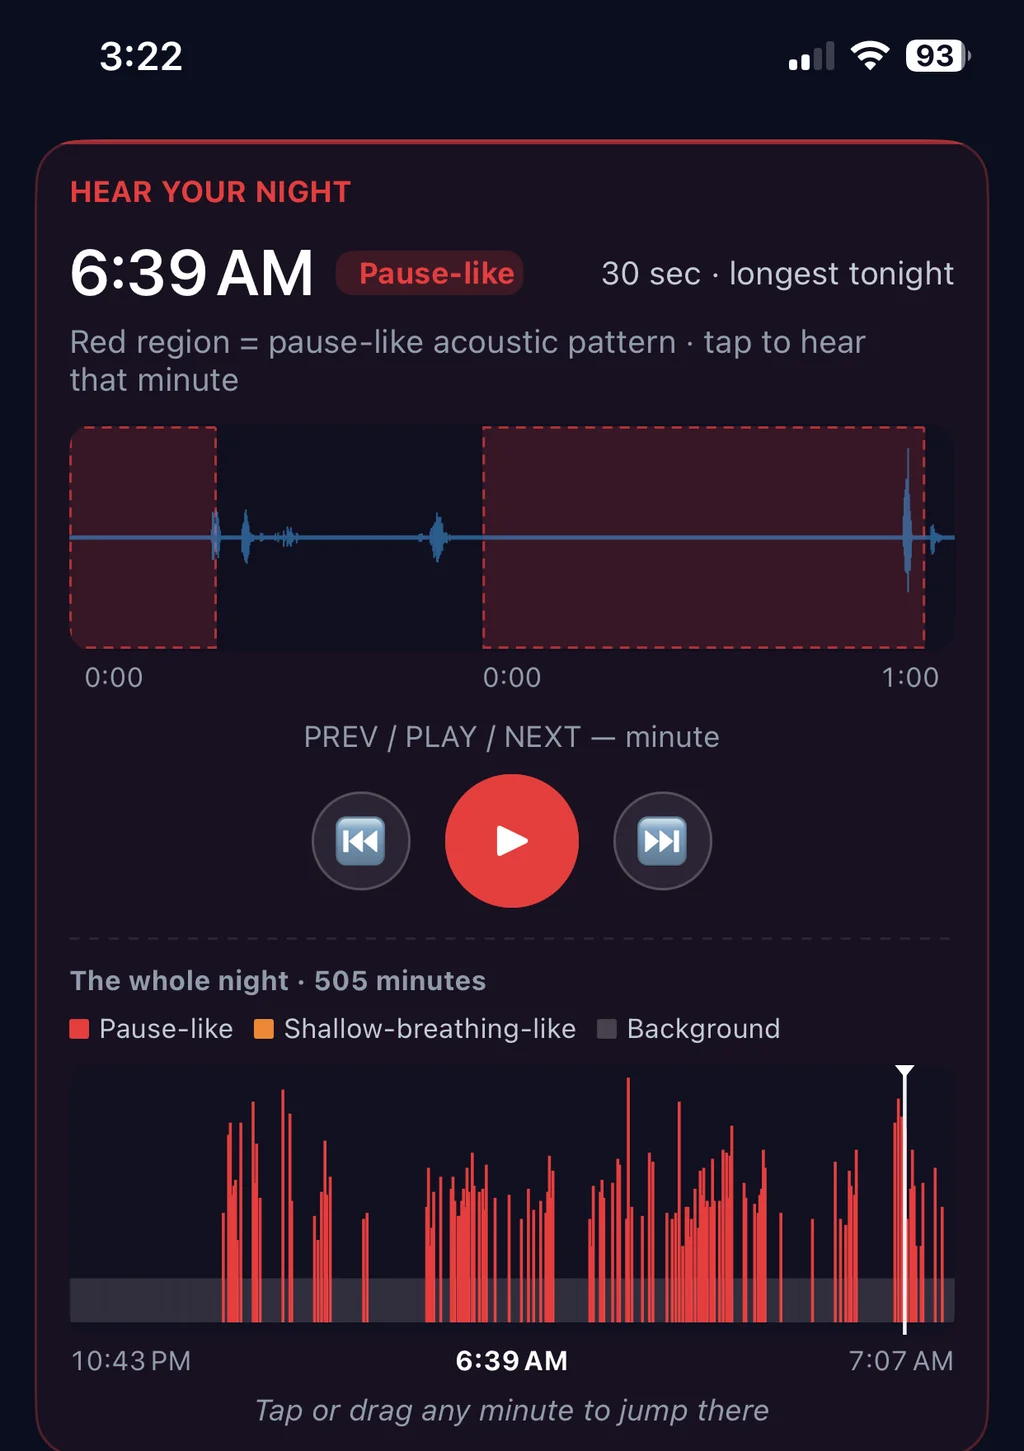
A count cannot tell you which part of the night to revisit. The timeline places possible breathing pauses in the whole-night record. Open a marked minute to see estimated timing and duration, inspect the waveform, and play the sounds around the candidate. These are phone-audio estimates, not PSG-scored events.
A count cannot show timing
Two sessions can produce the same nightly product index while their candidate events appear at different times. The timeline preserves that time context.
This can help you compare your own nights and recording conditions. It cannot identify sleep stages, oxygen changes, arousals, or clinical event severity.
What every line in the timeline gives you
For each night, the app lists candidate events produced by its acoustic model:
- Time — model-estimated start and end.
- Duration — estimated span of the candidate event.
- Type — the acoustic label assigned by the production model.
- Audio — an available local clip you can inspect.
A density visualization shows whether model output was spread across the session or concentrated in a particular period. Product color bands are visual navigation aids, not clinical AHI severity categories.
What this isn't
- Not sleep stage analysis. Time of night does not tell you whether a candidate occurred in REM, deep or light sleep. SomniSense does not measure EEG or establish clinical sleep stages.
- Not a diagnosis. "80% of events between 3:30 and 5 a.m." is a pattern. What it means medically is for a clinician. We surface the pattern. We don't interpret it.
- Not independently event-validated. The published breathing benchmark evaluates 200-second windows. It does not establish the accuracy of every event boundary, duration, or label shown here.
Free keeps core first-night candidate evidence and a recent 7-day trend. Pro adds longer continuity.
Read next
- → See & Hear Playback — review the recorded sounds around a candidate
- → How accurate is a phone at this, really? — what an event can and cannot establish
- → Accuracy and limits — read each benchmark with its exact task
- → Lifestyle Lab™ — see whether tagged factors shift the timeline