VALIDATED ACCURACY · METHODOLOGY OPEN
SomniSense Accuracy: What Was Actually Tested?
The 88.49% accuracy result is for classifying 200-second normal versus apnea-or-hypopnea research windows, not diagnosing people with OSA. The dataset contains 2,953 windows from 80 person-nights across 40 participants; Paper E reports a single-seed compression evaluation. Current App candidates remain observations you can inspect, not clinically confirmed events or a personal accuracy guarantee.
Paper A reports 91.67% sensitivity and 89.01% precision as five-seed means for 13,538 labeled one-second snore segments; these are not OSA patient metrics. Paper A
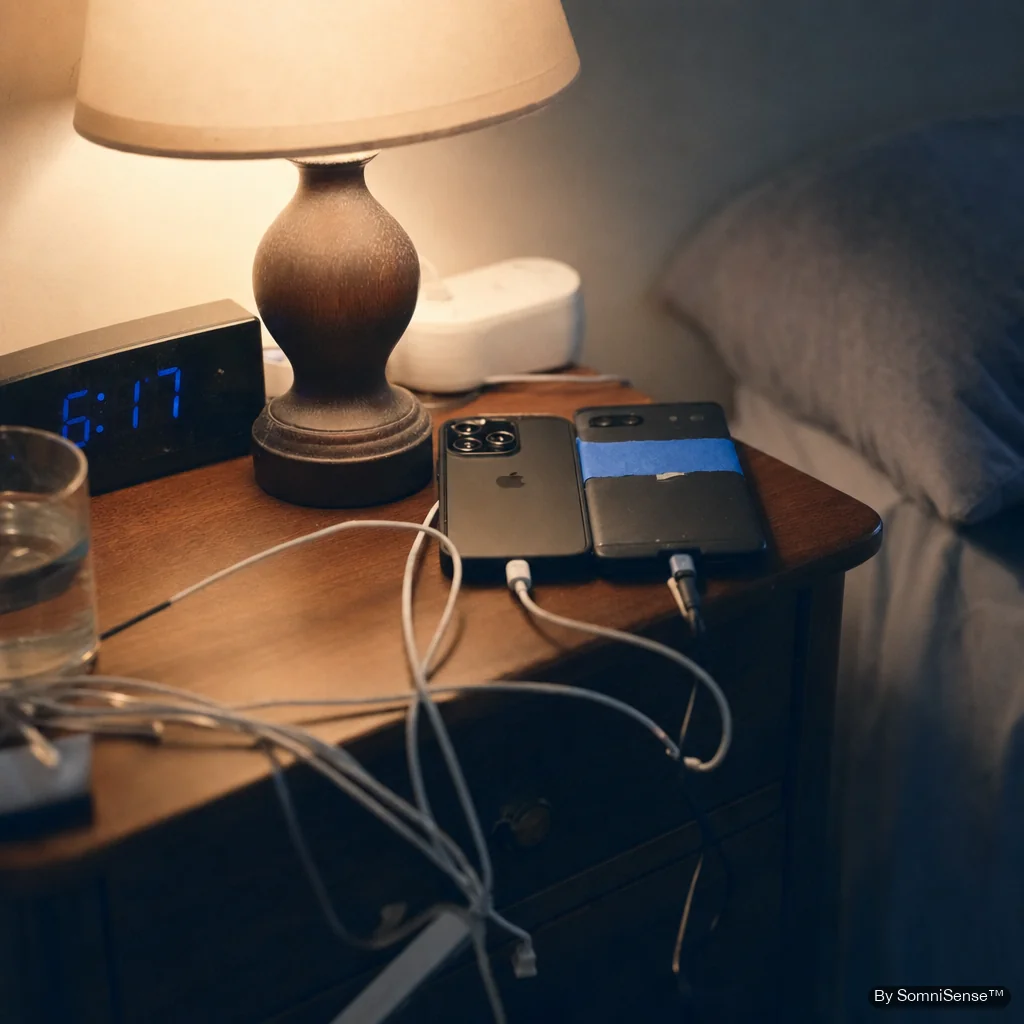
Illustration, not study data. The research corpus is described in the text.
WHAT SOMNISENSE ADDS
What the number means for the moment you open tomorrow.
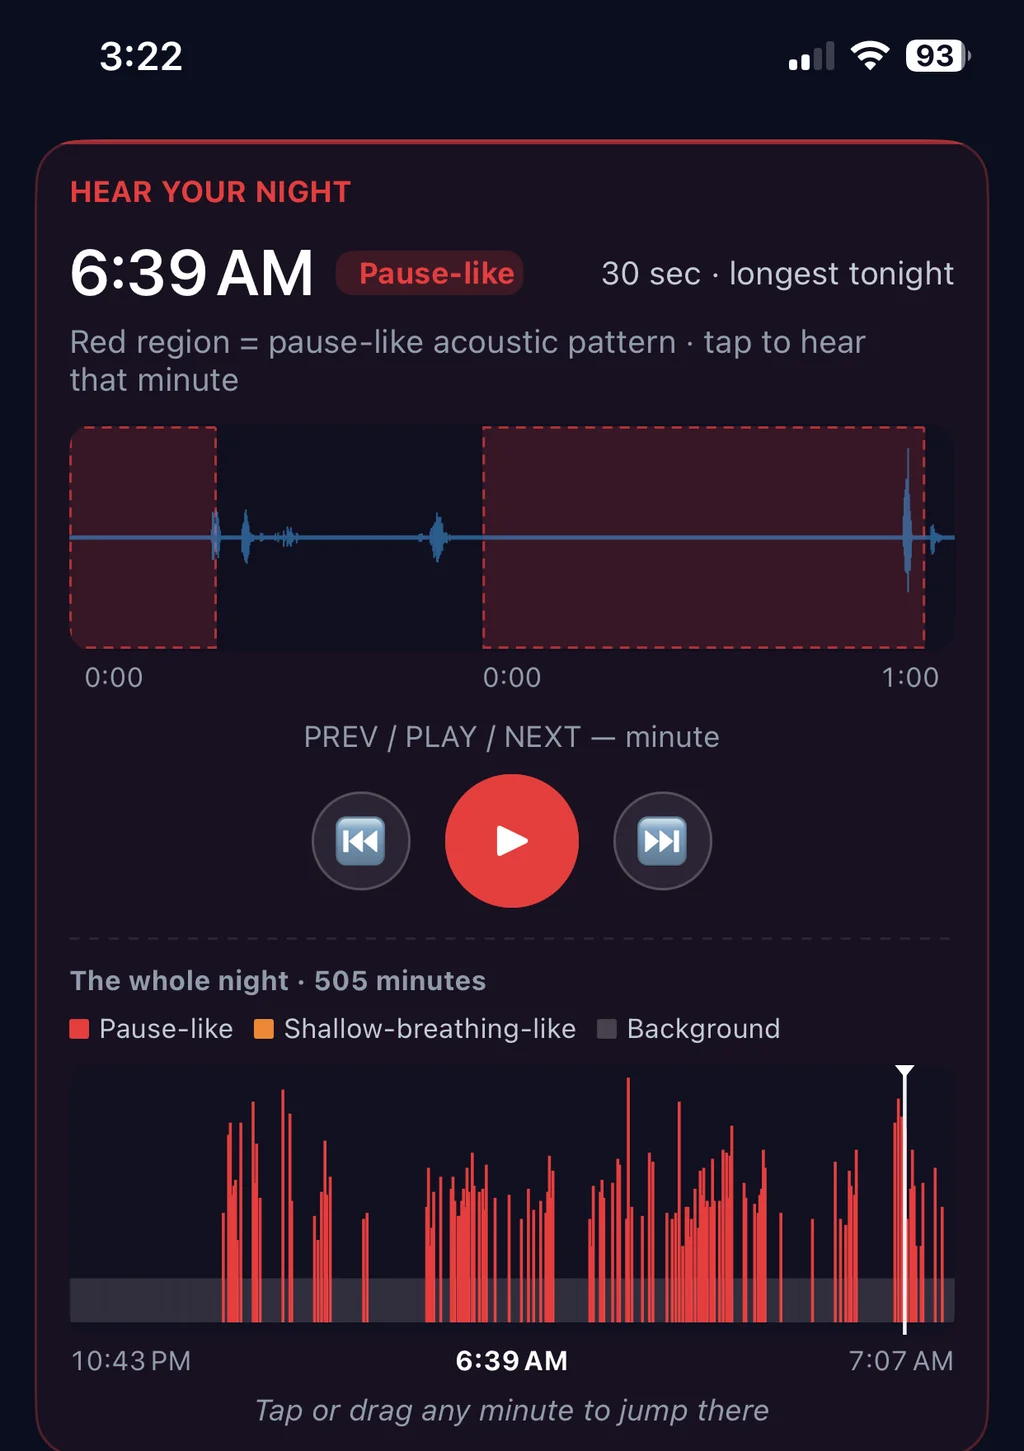
This real screen shows a possible breathing pause you can review: estimated time and duration, a marked waveform, playback and its place in the night. Listen to the preceding sound and the sound that resumes. The 200-second benchmark does not establish that each marked pause, duration or personal result is clinically correct.
- Candidate pause-like or shallow-breathing-like type, time, and model-estimated duration
- The marked waveform and playback of the sounds before and after the candidate interval
- Whole-night position, followed across nights in recent comparisons and structured reports
Phone audio is a limited wellness signal. Candidate regions are not clinical apnea events, AHI, oxygen measurements, airway-source findings, or a diagnosis.
Why the task definition comes first
The current research is available as open preprints and has not yet completed peer review. Each headline number belongs to a specific labeled task, dataset, and evaluation procedure.
We therefore state the task beside the metric and avoid carrying a benchmark result over to event boundaries, durations, product labels, individual bedrooms, or clinical diagnosis. If later peer review or expanded validation changes a result, this page will be updated.
The single-number problem
A single rounded “accurate” percentage is incomplete until you ask: accurate at what, on what population, and against which reference labels? Snore-segment classification, breathing-window classification, production event boundaries, and a whole-night index are different questions with different evidence.
SomniSense breaks accuracy into several numbers, each tied to a specific question. No one benchmark tells the whole product story.
Two indices, one app — and why the validation numbers split that way
SomniSense produces two product-defined indices each night. Their underlying model benchmarks evaluate different tasks:
- BRI is a product-defined candidate rate, not a research accuracy metric. Paper E reports 88.49% accuracy and 88.06% F1 for 200-second windows (2,953 total; single seed). Its Pruned+FT+QAT model has 9,416 parameters and a 56.4 KB file; the separate CoreML Pruned+FT forward-pass benchmark is 0.064 ms on Apple M2, excluding audio preprocessing and post-processing (200 calls, 20 warmups).
- SRI (Snoring Rate Index) — snore events per hour. The underlying 1-second snore-event benchmark reports 91.67% sensitivity and 89.01% precision.
Both BRI and SRI are product-defined wellness indices. BRI is not AHI, and the window-classification benchmark does not independently validate every event used to assemble a nightly index.
What our research measures, and what BRI actually does
Three different things, often mixed up. We try not to mix them:
- Window classification (what Paper E validates). Given a labeled 200-second window of bedside audio, the model classifies it as normal or apnea-or-hypopnea. Production benchmark: 88.49% accuracy and 88.06% F1.
- Per-night BRI (what the app reports each morning). The app aggregates candidate production events across the session:
BRI = candidate breathing-irregularity events / estimated sleep hours. This is a product-defined acoustic rate, not a clinical AHI. - OSA (Obstructive Sleep Apnea) diagnosis — what a sleep specialist does, not what SomniSense does. A clinical diagnosis based on polysomnography, daytime symptom assessment, and a physician's judgment. BRI is data; OSA diagnosis is a doctor's call.
Event start, event end, duration, product label, nightly BRI, and personal trends are production outputs. They should not be described as independently validated by the 200-second window result unless a separate published analysis evaluates that exact output.
The benchmark numbers we actually publish
| The question | The number | What that means |
|---|---|---|
| Of labeled snore segments, how many did the detector catch? | 91.67% | Snore-event sensitivity (recall) for 1-second segments; five-seed mean. |
| When the detector flagged a snore segment, how often was it right? | 89.01% | Snore-event precision for 1-second segments; five-seed mean. |
| How often did the compressed breathing model classify a labeled window correctly? | 88.49% | Production benchmark accuracy for normal vs apnea-or-hypopnea classification on 200-second windows. |
| How balanced was breathing-window performance across classes? | 88.06% | F1 for the same compressed production benchmark. Paper E does not publish a production sensitivity/precision pair, so we do not infer one. |
The research corpus includes 80 paired PSG nights across 40 participants (10 in-lab + 70 ambulatory PSG with nasal-airflow cannula). See the linked preprints for which subset, labels, and evaluation procedure apply to each reported metric.
The papers describe PSG-derived reference labels. They do not document a blinded scoring procedure or an independent prospective clinical evaluation.
How we tested it (the methodology, plain)

Illustration, not study data. The research corpus is described in the text.
Paper A describes retrospective classification against PSG-derived labels; Paper E evaluates compression on the derived feature dataset. These results do not establish clinical screening performance.
Specifically:
- Sample: 80 person-nights from 40 participants, including 10 in-lab and 70 ambulatory PSG nights. The papers do not provide systematic performance by demographic group.
- Recordings used varied consumer smartphone and tablet microphones and room settings. Per-device performance and a fixed recording distance are not established by these papers.
- Reference: audio paired with PSG-based event annotations. The exact scorer certification and blinding procedures are not documented in these sources.
- Published comparisons: task-specific snore-segment and breathing-window classification metrics. Production event boundaries and nightly indices require their own evaluation and are not silently inherited from those results.
The breathing-event detection algorithm builds on years of sleep apnea research by our founder. The version powering SomniSense was retrained from scratch and rebuilt for SomniAI LLC to handle smartphone audio specifically — different microphone, different distance, different acoustic context than clinical hardware. Three companion preprints document the methodology in full: the cascaded-baselines preprint (multi-seed bootstrap), the Coordinate-Attention 1D architecture preprint (93.2% parameter reduction), and the on-device compression preprint (compressed breathing-model inference measured at 0.064 ms on Apple M2 Neural Engine). All are published openly on Zenodo with citable DOIs (cs.LG, eess.AS). For how the two-stage system fits together and the full preprint portfolio, see the research program. The full technical hub — the architecture in depth, the SDK, and licensing for hardware and clinical partners — lives at apneasense.com/research.
Honest limitations
Here's what we don't know yet, and what I'd want to know if I were the user:
- The cohort does not represent everyone. Performance for an individual or an underrepresented population may differ; we do not assume the published aggregate is conservative for any particular person.
- Acoustic environment matters. If your bedroom has unusual acoustic properties — hard surfaces, partner snoring louder than you, a fan blowing directly at the phone — the model may catch fewer of your events. The methodology paper documents the conditions we tested under.
- Production outputs need output-specific validation. A window benchmark cannot establish the accuracy of every event boundary, duration, label, BRI value, or trend shown in the app.
- Not validated for under-18. The cohort was adults only.
- Preprints, not yet peer-reviewed. Three companion preprints are published openly on Zenodo with citable DOIs; peer-reviewed journal publication is a separate process and will be noted on this page when complete.
What this isn't
- SomniSense does not diagnose or screen for OSA. Clinical evaluation may involve PSG or an appropriate home sleep apnea test. The app is not validated for users under 18.
- Not a personal guarantee. Your specific results may differ from population averages. Read the methodology paper to know whether your scenario is in or out of distribution.
- Not a replacement for a sleep study. Do not apply clinical AHI thresholds to BRI. Symptoms or concerns deserve professional evaluation regardless of the app's value.
Not sure if this is your problem? Start from a symptom
If you came here to check the evidence before trusting the app, the other way in is whatever you're actually feeling. Each of these walks through the breathing pattern behind the symptom and what to do about it:
If this is the level of evidence that satisfies you
Free keeps core first-night candidate evidence, local playback within the app limits, and a recent 7-day trend. Pro adds continuity, not the basic right to inspect the first night. Purchase details stay on the pricing page.
Start with Free Review each benchmark and its boundary →