DIFF-4 · VALIDATED ACCURACY
We publish the numbers most sleep apps hide.
A single rounded accuracy percentage sounds great until you ask: accurate at what, on what population, against what ground truth. SomniSense publishes each benchmark with its task, unit, cohort and boundary — plus the methodology you can read end to end.
Launching soon. First 7 days free at launch · then $7.99/mo or $49.99/yr.
Here's the short, less-flattering version most apps won't give you: there isn't one accuracy number. Across 80 person-nights / 40 participants, the published benchmarks report 91.67% snore-event sensitivity, 89.01% snore-event precision, and 88.49% breathing-window accuracy with 88.06% F1. It's a wellness monitor, not a diagnosis — and the methodology is open enough that you can argue with it.
The single-number accuracy problem
Most consumer sleep apps quote a single rounded "accurate" percentage. I'll be honest — that kind of number used to mean nothing to me, and I built one of these things.
"Accurate" at what? Detecting that there was a sound? Distinguishing snores from background noise? Counting the right number of breathing pauses in a night? Different questions, different answers. Collapsing them into one rounded number is what you do when you don't want people to look closely.
The benchmark numbers we actually publish
| The question | The number | What that means |
|---|---|---|
| Of labeled snore segments, how many did the detector catch? | 91.67% | Snore-event sensitivity for 1-second segments; five-seed mean. |
| When the detector flagged a snore segment, how often was it right? | 89.01% | Snore-event precision for 1-second segments; five-seed mean. |
| How often did the compressed breathing model classify a labeled window correctly? | 88.49% | Accuracy for normal vs apnea-or-hypopnea classification on 200-second windows. |
| How balanced was breathing-window performance across classes? | 88.06% | F1 for the same production benchmark; Paper E does not publish a production sensitivity/precision pair. |
| How does our per-hour event rate compare to PSG event scoring? | 87% | Per-night BRI within ±5 of the PSG-scored per-hour event rate for 87% of nights. Preliminary system-level result; full by-severity analysis in a forthcoming preprint. BRI is not an OSA diagnosis. |
These come from n=80 paired PSG nights — meaning we ran SomniSense on a phone next to the same person, on the same night, in a sleep lab where they were also being recorded with a real polysomnography setup. Audio was scored by AASM-trained sleep technicians who didn't know what SomniSense had said.
That last part — "didn't know what we said" — is what blinded scoring means. We don't get to pre-train our scorers on our own answers. Otherwise the test would be circular.
Why I'm publishing this before the paper
The honest reason: the academic peer review for the paper is in active preparation. It hasn't published yet. Once submitted, peer review typically takes another 3–6 months, plus the patent application timeline.
If I waited, you'd have nothing to compare other apps against in the meantime. So I'm publishing the numbers and the methodology now, with the explicit caveat: they're from our internal study and haven't been peer-reviewed yet. When the paper publishes, this page gets the citation. If peer review changes any number meaningfully, this page changes — and I'll explain what and why.
That's the deal. I'd rather tell you something that might be slightly off and let you push back than say nothing for six months.
What you should know about the methodology
Full methodology at /accuracy; the full study and preprint portfolio live at apneasense.com/research. The short version:
- Sample size: 80 paired PSG nights / 40 participants, adults with and without diagnosed sleep breathing issues. We're specific about who's underrepresented — mostly under-18, severe BMI extremes, certain ethnic groups — rather than hide it behind an aggregate "nights" number.
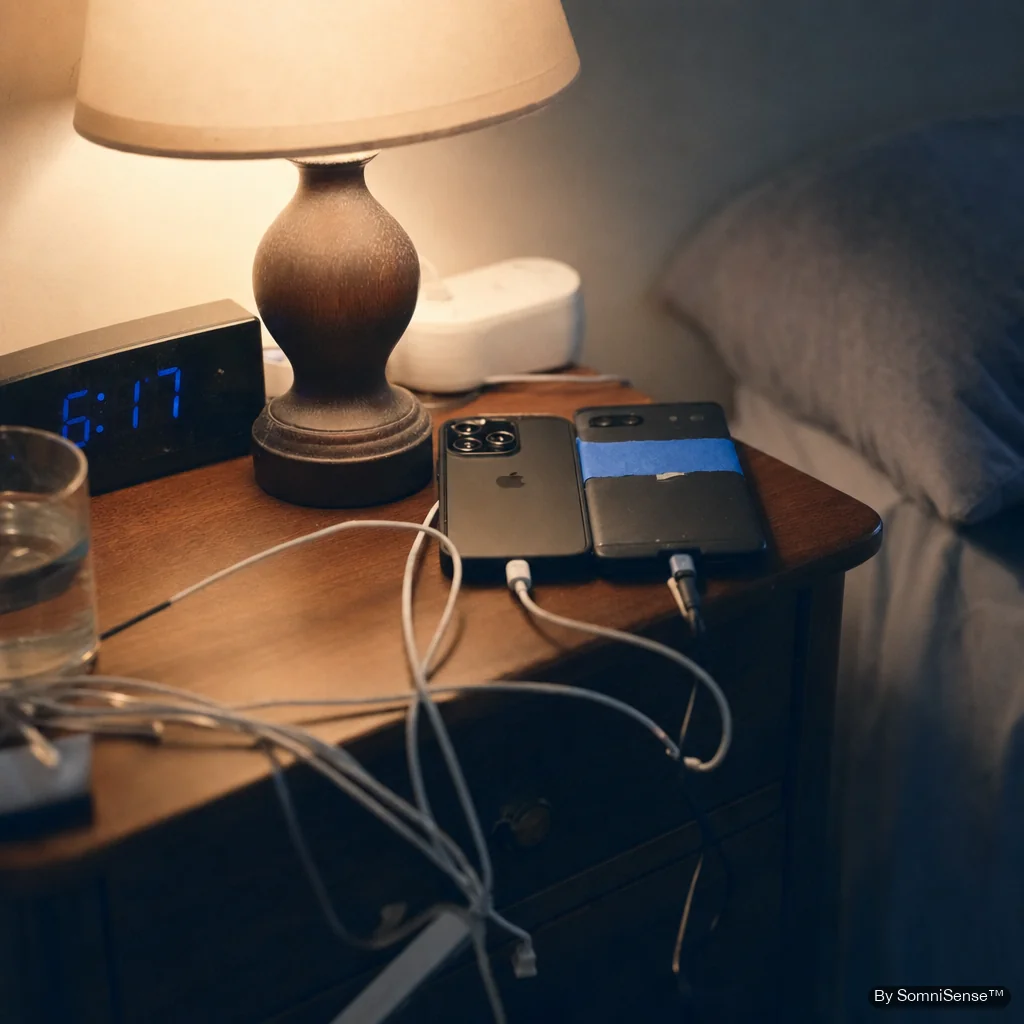
- Recording setup: a smartphone on the bedside table, 50–90 cm from the participant's head. iPhones and mid-range Androids from 2018 onward.
- Ground truth: in-lab polysomnography with synchronized audio, scored by AASM-trained sleep technicians blinded to what SomniSense said.
- Analysis: per-event sensitivity and precision (paper-reportable); per-night Bland-Altman agreement of BRI vs PSG-scored per-hour event rate (system-level validation; BRI is an acoustic estimator of the AHI-shaped metric, not a clinical OSA diagnosis).
The algorithm builds on years of sleep apnea research. The current version was retrained from scratch and rebuilt for SomniAI LLC to handle smartphone audio specifically — different microphone, different distance, different acoustic environment than clinical hardware. Peer-reviewed publication is in active preparation; a U.S. provisional patent application has been filed and is pending.
What this isn't
- Not a diagnostic claim. Even at these numbers, SomniSense isn't a medical device, doesn't diagnose obstructive sleep apnea (OSA), and isn't validated for users under 18.
- Not a personal guarantee. Your bedroom might be acoustically unusual. Your partner might snore louder than you. The model might catch fewer of your events. The methodology paper documents the conditions we tested under — read it if you want to know whether your scenario is in or out of distribution.
- Not a replacement for a sleep study. If your BRI runs above 15 consistently, that's a clinic conversation. We give you data to bring. The clinic gives you the diagnosis.
First 7 days of Pro are free · Cancel through the App Store or Google Play before day 8 to avoid the renewal charge.
Read next
- → Full methodology
- → The research program — the validation study, the two-stage model, and the preprint portfolio
- → Every-Event Timeline — what 91.67% sensitivity actually shows you
- → Doctor-Ready Cadence™ — getting these numbers organized for your doctor